The Dashboard Says Nothing
My Portfolio Disagrees

TL;DR: Stanford runs a dashboard to catch an AI growth explosion, and so far it hasn’t found one. Meanwhile four companies will spend about $730 billion on AI infrastructure this year. Either the statistics can’t see what’s coming, or it’s 1999 again – and that time the technology was right and the landlords still went bust.

On 21 October, three economists published a list of 21 questions about what AI will do to the economy. Erik Brynjolfsson, Anton Korinek and Ajay Agrawal write that “A question well-posed is half answered.” So that’s ten and a half answers.
Question two is mine. It asks what the main bottlenecks for growth will be. Most of my portfolio has already answered it: electricity. More precisely, two companies that hold power contracts and rent out data-center capacity to whoever needs the compute.
Further down, the paper asks for an economic dashboard that would warn us when an AI-driven growth explosion is getting close. Brynjolfsson’s own lab at Stanford already runs one: twelve indicators, updated every month.
So far, it hasn’t seen a takeoff.
Twelve Indicators, No Takeoff
The dashboard is called the Transformation Tracker, and it builds on a 2021 paper by William Nordhaus. He asked whether we were close to an economic singularity – the point where machines do so much of the work that growth starts speeding itself up – and wrote tests to spot it early.
If that were happening, a few numbers should move: productivity growth should accelerate, machines and software should take a bigger share of income, and output should break away from its old trend.
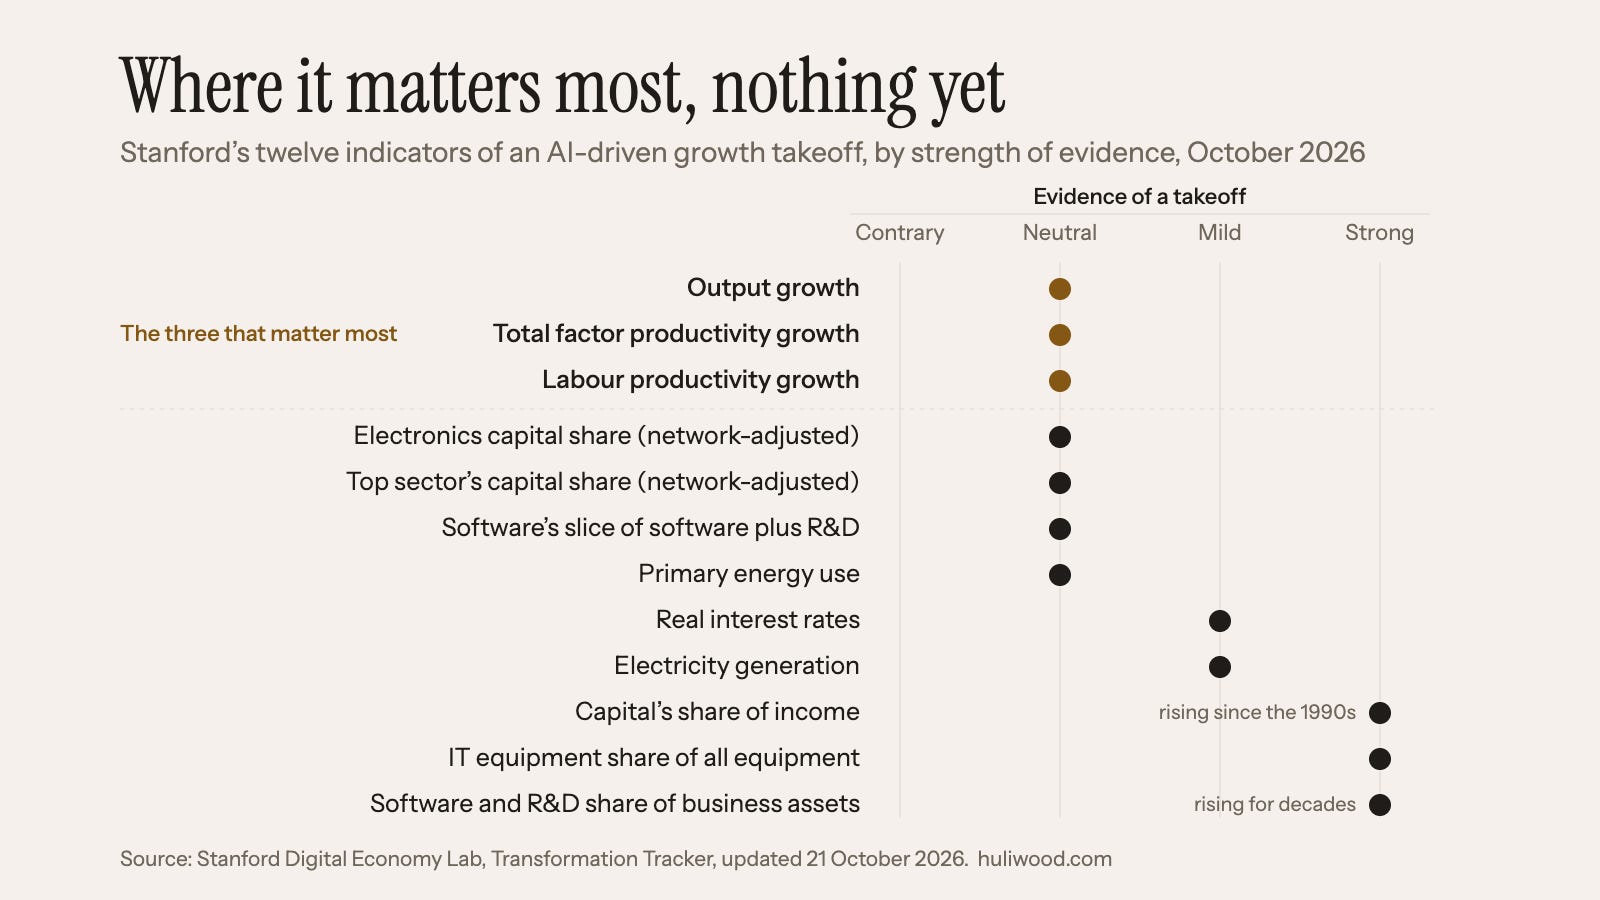
Two of the three strong ones were rising long before ChatGPT. One is software and R&D as a share of business assets. The other is capital’s share of income, which Man Group’s researchers put at roughly 31% in the early 1990s and about 40% today. They also point out that monopoly power, globalisation and thirty years of shrinking unions fit that rise just as well as robots do.
The third strong signal is recent: information-processing equipment, as a share of all business equipment, has only just climbed back to its early-2000s level.
Man re-ran all six of Nordhaus’s original tests with ten more years of data: one passed, three were ambiguous and two failed outright. Total factor productivity – the part of growth that more workers and more machines don’t explain – grew 0.88% a year from 2015 to 2025. During the late-1990s tech boom it grew 1.82%.
The official American numbers say the same thing in a friendlier voice. Labour productivity has grown 2.2% a year since the end of 2019, against 1.5% in the 2007–2019 cycle – better, and exactly the long-run average since 1947.
One indicator I didn’t expect to care about is interest rates. If people believed a much richer future was close, they would save less today and demand more to lend, which pushes real rates up. Stanford’s verdict: elevated relative to history, which it counts as mild evidence rather than strong. The bond market hasn’t fully signed up.
Meanwhile, $730 Billion
While the dashboard idles, the money doesn’t. Amazon, Alphabet, Microsoft and Meta have guided to about $730 billion of capital spending for 2026, most of it on AI infrastructure, up from about $410 billion in 2025. Amazon raised its own number from about $200 billion to about $220 billion in July, because memory chips got more expensive.
Someone has to earn that back. Since 2023 the investor David Cahn has tracked how much revenue the industry needs to pay off a single year of building. In September 2023 he called it AI’s $200 billion question. This July, it was AI’s $1.5 trillion question.
Gartner then ran a similar sum for the owners of the data centers – my side of the trade.
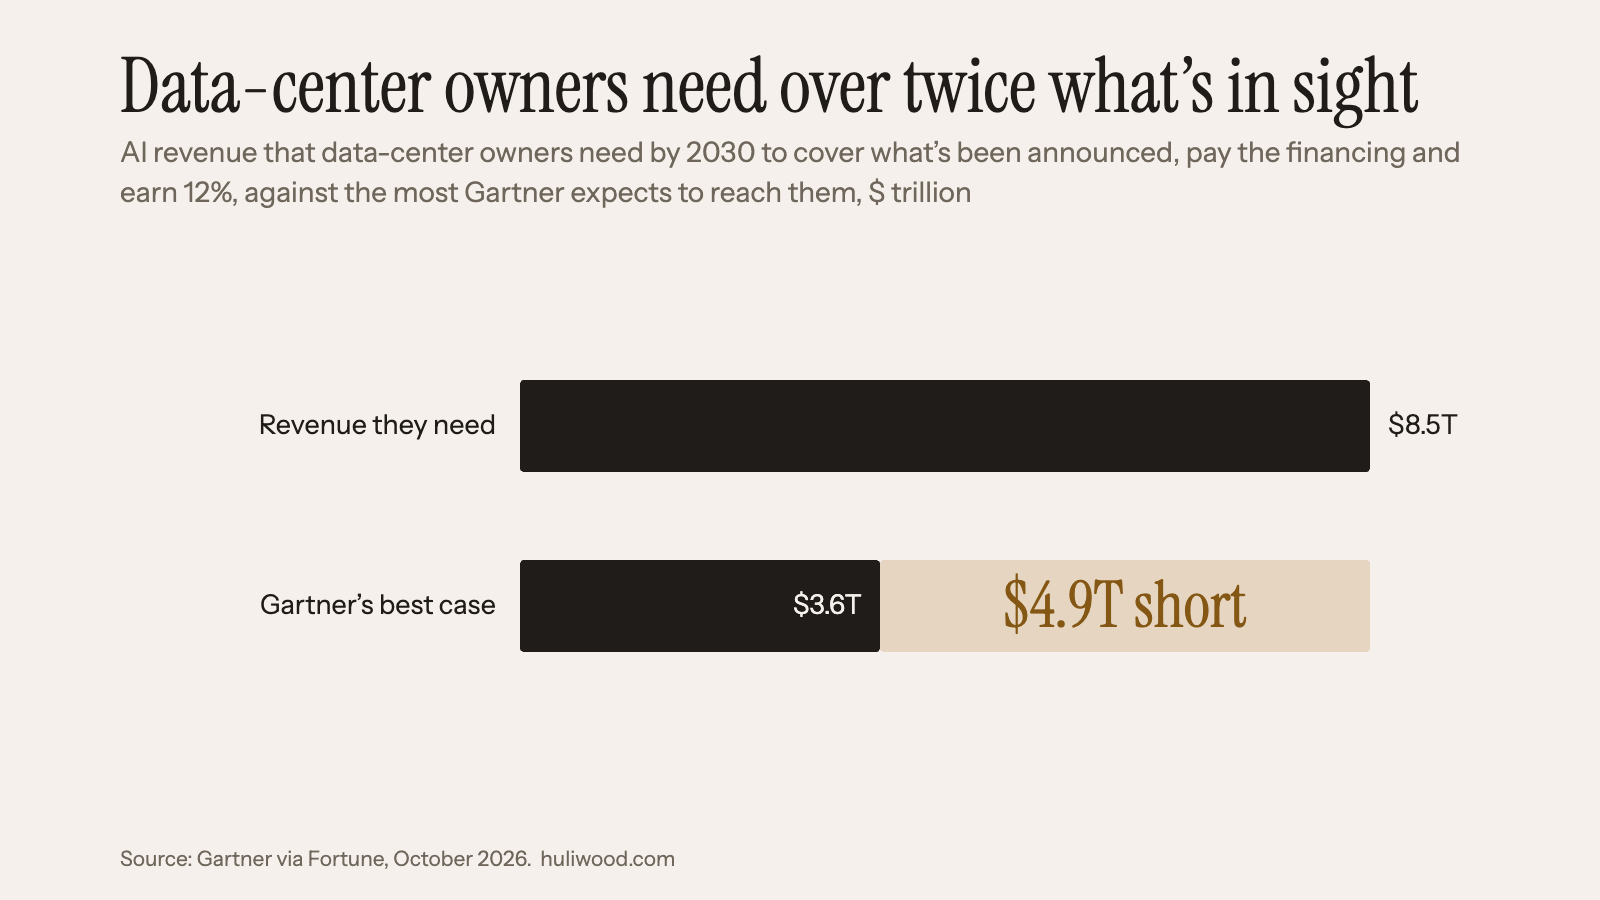
Gartner also expects more than 80% of neoclouds, the companies that rent out GPU computing as a service, to stop operating independently by 2030. IREN, my biggest position, is one of those companies.
So two dashboards disagree. Stanford’s says the economy hasn’t taken off. The other one is written in capex guidance, and it’s betting $730 billion this year that it’s about to.
Reading One: We’re at the Bottom of the J
The friendly explanation comes from Brynjolfsson himself. In 2021, with Daniel Rock and Chad Syverson, he published the productivity J-curve.
When firms adopt a general-purpose technology like electricity or computers, they spend years on things the national accounts don’t count as output: retraining people, rebuilding processes, writing software, reorganising who does what. Hours and money go in, nothing measurable comes out, and productivity looks flat. Later the investment pays off, and productivity looks better than it really is, because the statistics never counted what was put in.
They tested it on computers. Adjusted for the intangible investment that went with computer hardware and software, American total factor productivity at the end of 2017 was 15.9% higher than the official figure.
History has the same shape. By Man’s count, electricity took about forty years to show up in productivity statistics, and the personal computer about twenty. In 1987, Robert Solow wrote that he could see the computer age everywhere except in the productivity numbers. A decade later came the late-90s boom, the one Man still uses as the benchmark.
In this reading, the dashboard is quiet because it measures output, and right now the money is going into things that produce output later. The first signs would show up inside companies – revenue per employee, profit per research dollar – years before they reach the national accounts.
And the landlords get paid the whole way, because the bottom of the J is when everybody builds.
Reading Two: 1999, Then the Landlords Went Bust
The unfriendly explanation has a precedent too, and it’s closer to my portfolio.
In the late 1990s, the internet needed pipes, and companies raced to lay fibre-optic cable. About $90 billion of it went into the ground in four years. In 2001 a Merrill Lynch analyst estimated that carriers were using about 2.7% of the capacity they had actually lit.
The demand was real. Purchased transoceanic bandwidth grew 196% in 2000 and 212% in 2001, roughly tripling two years running. The internet turned out to be everything its believers had promised. The pipes went bankrupt anyway.
A technique called wavelength-division multiplexing, which sends many colours of light down the same strand, multiplied the capacity of each fibre by about a hundred while new fibre kept going in. So supply outran even tripling demand, and not because the builders were stupid: every improvement made the fibre already in the ground carry more traffic for less money.
In 2001, telecom companies made up 25.8% of corporate bond defaults by dollar volume. Global Crossing filed for bankruptcy in January 2002, listing $22.4 billion of assets. The investors who took control of the reorganised company paid a few hundred million dollars. Existing shareholders got nothing. The fibre lived on under its new owners.
The internet was right. Its landlords were early, and they had borrowed as if they’d be on time.
The AI version of wavelength-division multiplexing would be efficiency: each watt producing many more tokens. The AI Landlords thesis rests on the fact that you cannot print electrons, and that’s still true. But if each electron starts doing ten times the work, scarce power stops being so scarce per unit of output, and a building that was precious in 2026 is ordinary in 2029.
The Race Condition Missed a Third Future
In March I wrote The Race Condition, about two futures: one where AI destroys incomes faster than it makes things cheaper, and one where it makes things cheaper faster. Compute demand grows in both, I argued, so the infrastructure wins either way.
Both of those futures assumed AI works quickly. The dashboard raises a third: AI works, and it takes longer than the debt. That’s the J-curve and 1999 at the same time – the technology right, the payoff late, and the builders’ loans on a shorter clock than the economy.
The differences from 1999 cut both ways. The biggest spenders today are Amazon, Alphabet, Microsoft and Meta, and if they cut back, they survive it.
But I don’t own them. I own the layer between them and the grid, the layer that borrows to build and gets paid by contract. IREN raised $3 billion in convertible notes in May. Cipher, then still called Cipher Mining, sold a $1.4 billion bond for a Google-linked data center in November 2025. Gartner’s 80% casualty forecast is about the neoclouds in that layer.
Even inside that layer, my two companies aren’t the same bet: I named the thesis after landlords, and my biggest position is the one renting out the computers inside the building.
As of 6 November, those two companies are more than three-quarters of my portfolio. Both trade below what I paid for them on average.
I’ve always told myself the difference from 1999 is physics. You can’t lay power the way you laid fibre: grid connections take years, and owning megawatts that are already connected is the whole reason I hold these two.
That’s still true. What the dashboard asks is whether scarce power is worth what I paid if the economy it’s for turns up five years late.
I can’t find anything in the data that says the bottom of the J is behind us, so here’s what would change my mind, written down before I need it. If Stanford’s output and productivity indicators still read neutral at the end of 2027, and two of the four big spenders cut their capex guidance in the same quarter for a reason other than accounting, then I’m in 1999, and I’ll say so here.
Twenty-one questions, and I answered question two with my money before the paper came out. I’m betting on the J, and on 27 October I bought more of both. If the J-curve is right, I bought near the bottom of it. If 1999 is right, I bought the dip the way Global Crossing’s shareholders did: all the way to zero.
Related:
The Race Condition – two AI futures, one portfolio; this piece adds the third
The AI Landlords – the thesis under all of this: own the power, rent the buildings
Am I Early? – the personal version: early and wrong look identical until they don’t.
Sources: Brynjolfsson, Korinek & Agrawal, CACM, Oct 2026 · Stanford Digital Economy Lab, Transformation Tracker · Man Group, AI Boom, Bust or Something Else? · BLS, Productivity and Costs, Q3 2026 · David Cahn, AI’s $1.5T Question, Jul 2026 · Gartner via Fortune, Oct 2026 · Brynjolfsson, Rock & Syverson, The Productivity J-Curve, 2021 · Light Reading on fibre utilization, Jul 2001
Frequently Asked Questions
Is AI showing up in productivity statistics yet?
Not decisively. Of the twelve indicators in Stanford’s Transformation Tracker, three show strong evidence of an AI-driven takeoff, two show mild evidence and seven show nothing out of the ordinary, including output growth, total factor productivity and labour productivity. US labour productivity has grown 2.2% a year since the end of 2019, the same as its long-run average since 1947.
What is the productivity J-curve?
The productivity J-curve, from Erik Brynjolfsson, Daniel Rock and Chad Syverson (2021), says that firms adopting a general-purpose technology first spend years on things the national accounts don’t count as output – retraining, new processes, software – so measured productivity looks flat at first, then looks better than it really is once those investments pay off.
Is the AI data center boom like the 1999 telecom bubble?
The parallel is the gap between spending and revenue. In the late 1990s about $90 billion of fibre went into the ground in four years; in 2001 a Merrill Lynch analyst estimated that carriers were using about 2.7% of the capacity they had lit, and fibre builders such as Global Crossing went bankrupt while internet demand kept growing. For 2026, Amazon, Alphabet, Microsoft and Meta have guided to about $730 billion of capital spending, and Gartner estimates that AI data-center owners need $8.5 trillion of revenue by 2030 against no more than $3.6 trillion it expects to reach them.
What would show that AI capex is 1999 rather than the bottom of a J-curve?
The test set in this piece: if Stanford’s output and productivity indicators still read neutral at the end of 2027, and two of the four biggest spenders cut their capex guidance in the same quarter for a reason other than accounting, the 1999 reading wins.
Discussion about this post